

Snowflake Performance Tuning: 20 Proven Techniques to Speed Up Queries

After 30 years of experience building multi-terabyte data warehouse systems, I spent five years at Snowflake as a Senior Solution Architect, helping customers across Europe and the Middle East deliver lightning-fast insights from their data.
In 2023, he joined Altimate.AI, which uses generative artificial intelligence to provide Snowflake performance and cost optimization insights and maximize customer return on investment.
Certifications include Snowflake Data Superhero, Snowflake Subject Matter Expert, SnowPro Core, and SnowPro Advanced Architect.
Rewritten: 15-Jun-2025
Snowflake Query Tuning
In this article, you'll discover 20 practical tactics to enhance Snowflake query performance, based on extensive real-world experience. You'll learn how to pinpoint bottlenecks, optimize query design, and restructure data to boost speed and efficiency. Key strategies include using the Snowflake Query Profile, maintaining simplicity in query designs, being mindful with GROUP BY operations, managing warehouse allocations smartly, and leveraging techniques like partition pruning, clustering, and Change Data Capture (CDC) for incremental transformations. By following these best practices, you can achieve significant improvements in both performance and cost-efficiency.
Snowflake delivers exceptional performance out of the box — but that doesn’t mean every workload runs efficiently. In reality, many environments fall short due to poor query design, inefficient data structures, and avoidable bottlenecks.
In this article, I’ll walk through 20 practical tactics to improve Snowflake query performance — all based on real-world experience across more than 100 Snowflake projects. You’ll learn how to tune queries, structure data more effectively, and apply simple changes that can make a big impact on both speed and cost.
Performance Optimization Podcast
https://www.youtube.com/watch?v=JDyXq9774n0&t
1: Identify Query Bottlenecks with the Snowflake Query Profile
Before you can start optimising a Snowflake query, it’s essential to first understand what’s actually slowing it down. There’s little value in guessing — the key is to identify the bottleneck and focus your efforts where they’ll make the biggest impact.
To do this, use the Snowflake Query Profile (also known as the query plan). Pay particular attention to the ‘Most Expensive Nodes’ section — this highlights exactly which parts of the query are consuming the most execution time.
By understanding where the query is spending its time, you can make targeted optimisations rather than broad (and potentially unnecessary) changes.
Let’s consider a simple SQL query below which produced the query profile below:
select o_orderstatus,
       sum(o_totalprice)
from orders
where year(o_orderdate) = 1994
group by all
order by 1;

Notice the profile (left) shows the query spent almost 95% of the effort in a Table Scan of the ORDERS table. Also (right), that it spent a total of 77% of the wait time, waiting for either Local or Remote disk. This clearly indicates, if you need to improve the performance, you need to reduce the I/O time.
Equally, if the query spent 90% of the time on step [2] (the Aggregate step) and we saw Spilling to Storage, this might indicate a huge sort operation which needs to be addressed.
2: Simplify Snowflake Queries to Improve Performance
“Simplicity is the ultimate sophistication.” – Leonardo da Vinci
After 30+ years in IT the most important lesson I’ve learned is to “Keep it Simple - Stupid”. I find people sometimes produce over-complex solutions instead of breaking down the problem into smaller chunks.

Take for example the above query profile as an example. If you had to tackle a performance issue with this - how confident would you be?

3: Avoid Nested Views in Snowflake (Views on Views)
Closely related to the Keep it Simple advice above is to avoid views on views. Take the hugely simplified diagram of a situation I saw with a recent Snowflake customer. They had a query which fetched data from a “table” - but in reality it was a view which joined several tables - which (you guessed it), turned out to be even more views.

The query normally took 30 minutes to complete, but it suddenly changed to four hours, but it took two weeks to diagnose the problem. Worse still, using views on views has the appearance of simplicity but it simply hides the complexity.

The diagram above illustrates how we solved the problem. We broke the query up into three separate sections, each producing a table, which was then fed into the final join. This meant all three components could run in parallel, it simplified and broke down the problem and even improved the overall query performance as the query was simplified.

4: Optimize GROUP BY in Snowflake to Prevent Performance Issues
Consider the query profiles below. The one on the left took 6 minutes to complete, whereas on the right a similar query completed 33 times faster. Can you think why?

Top marks if you spotted the “Bytes Spilled to Local Storage” - but in reality the underlying issue was the left query performed a GROUP BY on a unique key with 1.5 billion unique entries whereas the right hand query grouped the exact same data by just 5 unique keys.
Want a fast way to check the cardinality of a column? Use the following query as an example:
select approx_count_distinct(ss_sold_date_sk)
from SNOWFLAKE_SAMPLE_DATA.TPCDS_SF100TCL.STORE_SALES;
Using the APPROX_COUNT_DISTINCT function, you don’t need to wait for hours for the result which is around 99% accurate. This will tell you whether you’re dealing with a billion unique rows or 10,000.
Where I’ve seen this in production systems is queries which include a GROUP BY on a huge list of columns. Clearly, the query was trying to remove duplicate values - but surely it’s better to correct the duplicates problem than have repeating queries that GROUP BY almost every column in the table.
5: Prevent Spilling to Storage in Snowflake Queries
The diagram below illustrates the internals of an XSMALL virtual warehouse.

Essentially, when a query includes a GROUP BY an ORDER BY or a Window Function, it needs to sort the data and there’s a risk of spilling to storage. This is because sort operations (by far the most computationally expensive operation), are normally execute in memory. But if the sort is too large, it spills intermediate results to SSD (Local Storage) and then to extremely slow Disk (Remote Storage).
It’s relatively easy to identify spilling to storage using the following query. Note: We’re only really interested in queries that spill more than 1GB - always start with the worst offending queries.
select *
from snowflake.account_usage.query_history
where bytes_spilled_to_local_storage  > 1024 * 1024 * 1024
or    bytes_spilled_to_remote_storage > 1024 * 1024 * 1024
limit 100;
The solutions include:
Check the cardinality of the GROUP BY in either the query or window functions
Remove unnecessary sort operations (if possible)
If all else fails - consider moving the query to a larger warehouse
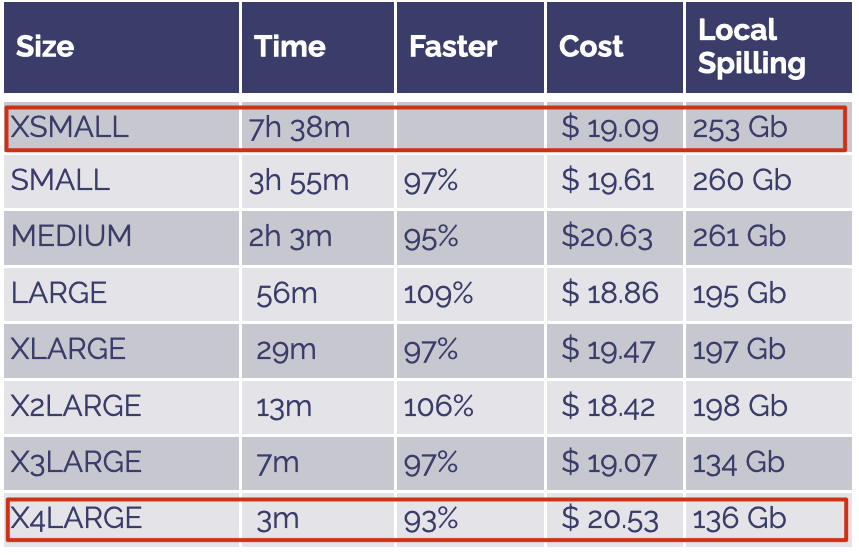
The table above shows results of a benchmark test. On an XSMALL warehouse the query took over 7.5 hours but on an X4LARGE it completed in just three minutes. Thats a performance improvement of nearly 153 times for less than $1.50 increase in costs.
However, the key takeaway here is not just the performance improvement, but the fact that the query around around twice as fast as the warehouse size was increased.

6: Right Size Virtual Warehouses: Balance Query Performance and Cost
Don’t EVER resize an existing Virtual Warehouse!
Most data engineers reading this will immediately disagree with the above statement. After all, being able to resize compute resources is one of the main benefits of Snowflake - right?
Hover, the intelligent approach is to “Move the Query” - Don’t Scale Up the warehouse.
I’ve completed an analysis of millions of queries against multi-million dollar Snowflake customers and it’s clear than the virtual warehouses have been increased in size. Typically a SMALL warehouse is initially deployed, and then as the workload increases, the size is increased until it becomes so expensive to operate it’s sized back down (perhaps from an X2LARGE to a LARGE) and people simply accept the poor query performance.
The correct approach is to identify the offending query and test it against a larger warehouse. If it goes twice as fast - MOVE IT TO A BIGGER WAREHOUSE! This means the smaller queries continue to execute on the smaller warehouse, while the massive, complex queries execute on a larger warehouse.
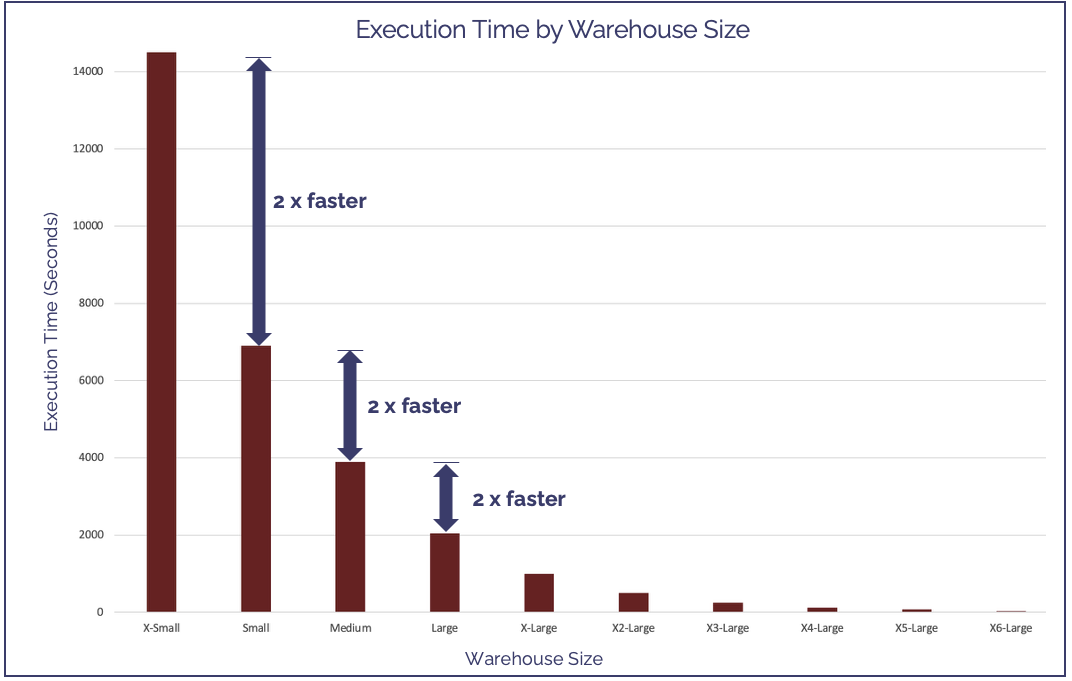
Consider the chart above. It illustrates that large, complex queries (processing billions of rows and gigabytes of data with massive sorts) normally execute twice as fast as you execute them on a larger warehouse. However, executing short running queries on anything larger than a SMALL warehouse is a waste of money.
Be aware also, not every query will execute twice as fast - even though it’s spilling to storage. Take for example this simple query:
select *,
    lag(value) over (
        order by created_at asc
    ) as lag_value
from large_table;
order by
    created_at
;
I can guarantee this query won’t run any faster on a larger warehouse despite the fact it’s spilling to storage. The reason is because it doesn’t include a PARTITION BY clause in the window function. Effectively, the PARTITION BY clause partitions the data and distributes the work to each node in the cluster. Without this clause, the entire operation is executed on a single node, leaving all others idle.
Of course, if you tested this against a larger warehouse (instead of just increasing the warehouse size), you’d spot this quirk of Snowflake.
Looking to optimise costs?
While this article focuses on query performance tuning, better performance can often help reduce costs. However, suppose your primary goal is cost reduction. In that case, you may also want to read my article on Snowflake Cost Optimization, which provides a comprehensive set of actionable strategies to help you control your spend.
7: Use MAX_CLUSTER_COUNT to Improve Query Concurrency
Be aware in addition to scaling up (executing queries on a larger warehouse), you can also scale out. I first heard of this working with Deliveroo who named Monday as “Manic Monday” because their previous system ground to a halt every Monday when 1,000s of queries ran concurrent queries to check the weekend sales.
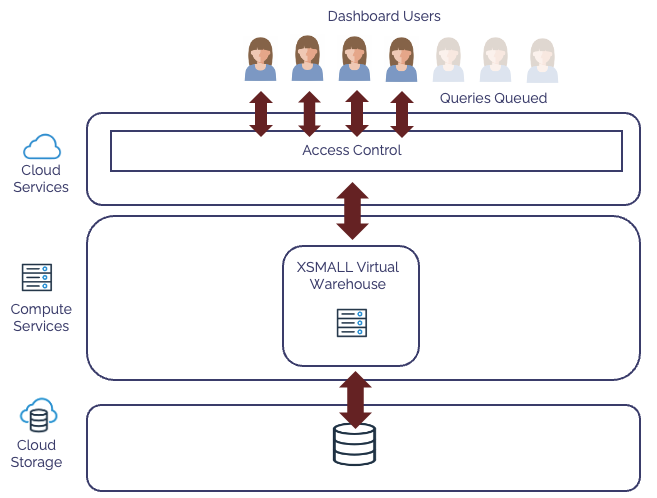
The diagram above illustrates what happens when too many users execute queries against a warehouse. To avoid poor query performance for everyone, the additional queries are queued until there is sufficient resources available. The solution is simple:
alter warehouse SALES_ANALYSIS_WH
set   min_cluster_count = 1
      max_cluster_count = 3;
Any queued queries are immediately started on up to three clusters (in this case), and the workload is balanced across all three as illustrated in the diagram below:

Best of all, as the workload subsides, the clusters are suspended, reducing the cost which is automatically managed throughout the day as illustrated in the diagram below.

8: Tune Snowflake Warehouse Scaling Policy for Cost and Performance
While this will help improve spend rather than performance, it’s important to understand how scale out works. By default, Snowflake will immediately start additional clusters to avoid queuing, but when processing batch queries (for example over-night reports or transformations), it’s better to restrict the scale out to maximize throughput. It’s simple, just execute the following query:
alter warehouse SALES_ANALYSIS_WH
set   min_cluster_count = 1
      max_cluster_count = 3
      scaling_policy    = ECONOMY;
Unlike the default, this waits until there’s six minutes of work queued up before adding additional clusters which keeps the warehouses fully utilized.
Remember, queuing is only to be avoided if your priority is to maximize performance (ie. reduced latency) at the expense of cost. By default, the multi-cluster feature will maximize performance of individual queries but may lead to a higher than expected cost.
9: Filter Rows Early to Improve Snowflake Query Speed
The fewer rows you need to process, the faster your queries will complete. This may seem obvious, but it’s surprising to find queries which don’t filter out rows using a WHERE clause (especially in inline views) which potentially cripples query performance.

Consider the query profile above of a query take took over two hours to complete. The query spent 63% of it’s time waiting for processing which indicated a large sort operation, but in reality this was misleading. In reality it performed a full table scan of 15,514 micro-partitions, whereas adjusting the WHERE clause restricted the rows fed into the Window Function and had a massive impact upon query performance.
10: Use LIMIT in Snowflake for Faster Results
Let’s assume you’re working on a new project and you need to see the data in a table. You’d most likely execute the following query:
select *
from sales;
However, you could be waiting for minutes or even hours before you get to see the results, even if you only want to see the first few rows.

The diagram above illustrates why this simple query takes so long. Any results (even when executed on a huge virtual warehouse) must first be returned via the results cache and a massive table will often be spilled to remote storage which kills query performance.
If however you use a LIMIT clause you can speed the query as Snowflake knows you only need the first X rows. For example:
select *
from sales
LIMIT 1000;
In a benchark test the query above returned in 50 milliseconds compared to two minutes without the LIMIT caluse. Best of all, this always works - even if you have an ORDER BY clause.
11: Rewrite OR conditions in Snowflake WHERE clauses for better performance
Consider the following query which falls into the trap known as the disjunctive OR problem.
select l_orderkey
,      l_partkey
,      l_suppkey
,      l_quantity
from lineitem
,    partsupp
where l_partkey = ps_partkey
      or
      l_suppkey = ps_suppkey;
The difficulty here is the query plan generates a Cartesian Join as illustrated below, and this will kill your query performance as an 8m and 60m join produces nearly 5 billion rows:

The sensible approach is to simply rewrite the query as two separate joins, and UNION the result sets of both as shown below:
select l_orderkey
,      l_partkey
,      l_suppkey
,      l_quantity
from lineitem
,    partsupp
where l_partkey = ps_partkey
union
select l_orderkey
,      l_partkey
,      l_suppkey
,      l_quantity
from lineitem
,    partsupp
where l_suppkey = ps_suppkey;
The new query profile (although it appears larger) combines the results of two independent joins and produces results about 25 times faster than before.

Finally, the query profile overview below shows the difference in performance.

Simply rewriting the query as a UNION produced the results over 200 times faster than using the OR clause in the WHERE.

12: Don’t wrap columns in Snowflake WHERE clauses (Enable Partition Pruning)
Consider the following simple query which filters results for a specific date. Can you see why this might impact query performance?
select *
from orders
where to_char(o_orderdate,'YYYY-MM-DD') = '2025-01-24';
The problem is in the use of the TO_CHAR() function which wraps the O_ORDERDATE column. Simply re-writing this query as follows leads to a massive five times improvement in query performance because it allows Snowflake to filter out data more effectively using partition pruning.
select *
from orders
where o_orderdate = to_date('YYYY-MM-DD') = '2025-01-24';
13: Avoid SELECT * for Better Query Performance
Snowflake stores data in columnar format which means it’s optimized for queries that return a few columns from potentially very wide tables. However, if every query returns every column, it has more work to do.
Consider the following queries:
select o_orderkey
,      o_totalprice
from  ORDERS;

select *
from  ORDERS;
I executed a benchmark test on an XSMALL warehouse and the results were as follows

Selecting only two columns completed in just 3m 21s whereas SELECT * took 15m 31s - a 500% improvement in query performance.
You’ll see that both queries scanned 3,242 micro-partitions (a full table scan), but the SELECT * query scanned over 48GB of data - around four times the volume of the previous query.
Clearly, you should avoid SELECT * unless you really need to return the full data set.
14: Improve Snowflake Query Performance with Partition Pruning
Every time you execute a query on Snowflake the WHERE clause is examined to limit the number of micro-partitions scanned. This works for every column on the table and is completely automatic. However, you can improve this “Partition Pruning” if you know how it works.
Consider the diagram below which shows how Snowflake actually stores data. It holds metadata in the Cloud Services layer including the minimum and maximum value of every column in every micro-partition.

In the above example, we’ve loaded data each day from January to March and the dat is appended into four micro-partitions.
Now let’s say we execute the following query:
select *
From sales
where sale_date = to_date('14-Feb-2026','DD-MON-YYYY');
Snowflake will automatically apply Partition Pruning against the table. Using the metadata, it knows the data cannot be in any other micro-partition than number 3, and therefore all other micro-partitions are pruned (skipped) which has a dramatic impact upon query performance.

The diagram above illustrates how this works, and best of all it works automatically against every column that appears in the WHERE clause.
The screenshot below illustrates the potential performance benefits of using partition pruning:

The screenshot above illustrates how two queries against the same table can produce dramatically different performance. The one on the left scanned the entire table whereas the one on the right eliminated all but four micro-partitions and was 740 times faster.
15: Use Snowflake Clustering Keys to Improve Query Performance
As we can see above, Partition Pruning can have an amazing impact upon Snowflake query performance. Using Data Clustering we can ensure queries against specific keys which frequently appear in the WHERE clause are maximized.
The diagram below illustrates what Data Clustering really means - effectively we “sort” the data by a given key which means data is “clustered” together.

The table on the left shows the data as it was loaded, whereas the table on the right shows the same results when the data is clustered by SALE_DATE. It’s easy to add a cluster key to a table using the following SQL:
alter table SALES
cluster by SALE_DATE;
Be aware however, clustering is NOT the same as an index, and the actual data sort is executed in background (taking hours on a large, terabyte size table). I’ve also seen many projects spend huge effort and Snowflake credit cost and achieved nothing.
Further Reading: Best Practices to Maximize Query Performance Using Snowflake Clustering Keys
16: Cluster Dimensional Tables by Join Keys for Faster Joins
Consider the following query which joins results from the SALES and PRODUCTS tables. This is a classic query from a Dimensional Model whereby we need to analyze both sales by product categories.
select product type,
       sum(sales)
from   sales s,
       products p
where  s.product_key = p.product_key
and    s.sale_date between '01-JAN-2026' and '31-JAN-2026';
One way to maximize query performance is to include the join key in the cluster key as follows:
alter table SALES
   cluster by SALE_DATE, PRODUCT_KEY;

alter table PRODUCTS
   cluster by PRODUCT_KEY;
This works effectively because Snowflake is able to execute run-time optimizations to return only the PRODUCT entries that match the corresponding SALES.
Of course this can only be achieved with a single join table, but it’s a useful tip to remember for large dimensional tables like PRODUCTS or CUSTOMERS which are frequently joined to large fact tables.
17: Use Clustered Keys for Faster ORDER or GROUP BY in Snowflake
It’s worth understanding not just that data clustering improves query performance, but why. Data clustering effectively sorts the data by the key and stores it together in the micro-partitions. We can use this to maximize performance, not just for partition elimination but to speed up ORDER BY or GROUP BY operations.
Consider the query below which ran against a huge data volume (3,242 micro-partitions), but returned in just 10 seconds:
select o_orderdate
,      sum(o_totalprice)
from orders
group by 1
order by 1;

The Query Profile above illustrates that despite sorting the entire table, the query spent just 9.8% waiting for CPU time (percentage waiting for processing), and the query completed within ten seconds. The underlying reason was the data was clustered by O_ORDERDATE which meant there was almost nothing to do in the sort operation.
18: Avoid Row-By-Row Processing in Snowflake. Use Set-Based Operations
Consider the following simple Snowflake Script which inserts just 10 rows. How fast do you think this will complete? One second, two seconds?
create table row_by_row (x varchar);

execute immediate $$
-- Snowflake Scripting code
begin
  for x in 1 to 10 do
    insert into row_by_row values ('X');
  end for;
end;
$$;
Now compare the above script to the following query which inserts three million entries. Do you think this will run faster or slower than the script above.
insert into orders
select o_orderstatus
from sample_data.tpch_sf1000.orders
limit 3000000;
You may be shocked to find the query which inserted 10 rows took 12 seconds, but inserting three million rows took just 2 seconds.
I’ve had similar experience with the Oracle database. Modern relational databases are tuned not for individual row-by-row processing, but massive bulk processing operations.
19: Use Change Data Capture (CDC) for Faster Snowflake Transformations
It’s a little known fact that around 80% of the compute effort and cost is spent on transforming data. This means, if you can improve the performance of transformation steps you’ll not only reduce costs but leave free resources to speed other queries.
However, time and again I see Snowflake deployments reprocessing an entire data set rather than identifying the changes using a Change Data Capture (CDC) method.
Let’s assume you receive a full set of the entire set of 5 million CUSTOMERS every day and need to process changes. You have two potential options:
Process every row in the source and merge into the target (Insert or Update)
Identify what’s changed and apply the differences.
Option 1 updates every row in the CUSTOMER table with a correspondingly huge impact upon both query performance and storage.
Option 2 uses the HASH_AGG() function against the non-key columns and uses this to determine whether rows have changed. Only these rows need to be updated which can have a massive impact upon query performance.
Using this technique can produce orders of magnitude improvements in transformation tasks and deliver results faster for subsquent analysis.
20: Optimize Snowflake Physical Data Storage for Query Performance
Consider the following query profiles which were exactly the same MERGE statement against data in the same table, but had a massive difference in performance.

This is one of the advanced features I cover in my Snowflake training course Mastering Snowflake: Fundamentals, Insights and Best Practices.
Notice the query on the left took nearly four hours to complete and wrote over a terabyte of data whereas the query on the right took less than nine minutes and wrote megabytes?
The diagram below illustrates the physical storage layout of the slower query in which one or two rows were updated in almost every micro-partition in the table.
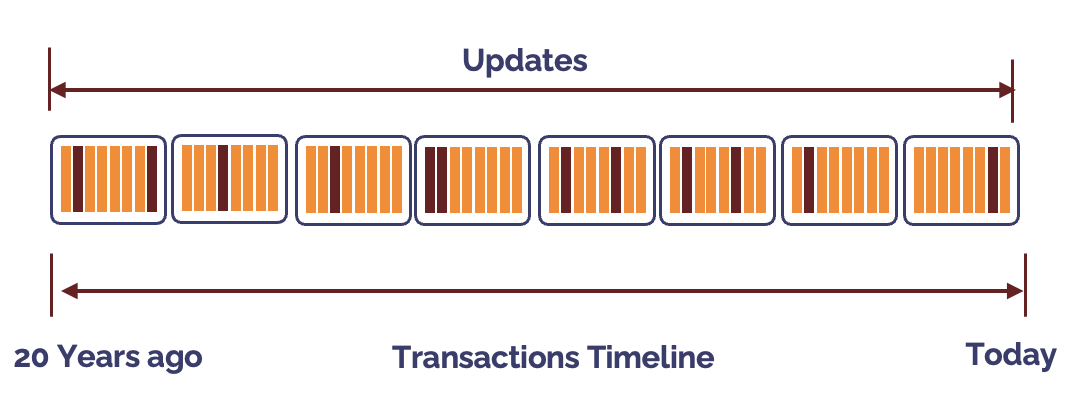
Compare this to the following diagram which shows the faster query which updated the exact same rows, but in this case updated fewer micro-partitions.
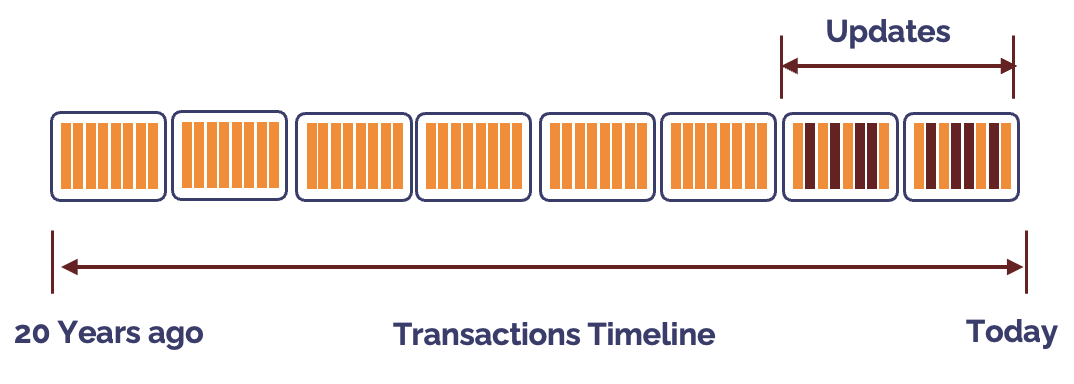
This massive performance difference is because updates create a new version of modified micro-partitions and the number of rows updated is less important than the number of micro-partitions modified.
The diagram below illustrates how Snowflake manages updates by creating a new micro-partition version and marking the previous entries for Time Travel.
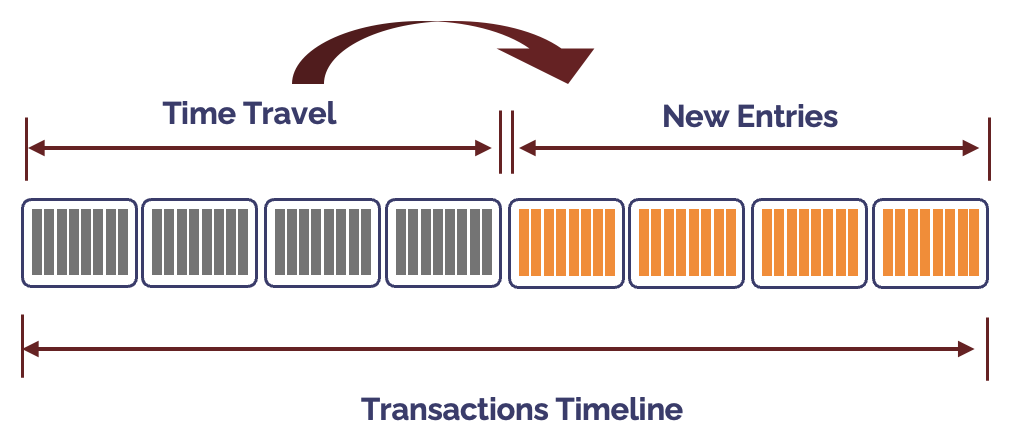
Simply being aware of this can help because it means you can adjust your processing and warehouse allocation accordingly. For example, a process that updates rows across multiple micro-partitions could be moved to a larger virtual warehouse.
However, the most effective solution is (ideally) to cluster the data by the update key. If for example most updates are against the most recent data, clustering by DATE will improve both the query performance (assuming queries filter entries by DATE) and also the MERGE or UPDATE statements as the most recent entries are clustered into few micro-partitions.
Want to go deeper on Snowflake performance?
If this article has been useful, the course takes these techniques further — covering the architecture decisions, performance patterns, and cost trade-offs that matter in production Snowflake environments. It is designed for data engineers and architects who already know the basics and want to use the platform at its best.
Conclusion
Optimizing Snowflake query performance isn’t about guesswork — it’s about understanding the underlying factors that drive performance and applying proven best practices. By focusing on bottleneck identification, keeping query design simple, avoiding excessive compute operations like large GROUP BYs or spilling to storage, and leveraging techniques like partition pruning, clustering, and scaling correctly, you can achieve dramatic gains in both speed and cost-efficiency. Remember: the smartest tuning approach is always one grounded in data — test, measure, and adjust. And if you have insights or techniques of your own, I’d love to hear them!
Next Steps

Frequently Asked Questions (FAQ)
What is the fastest way to improve Snowflake query performance?
The fastest way is to identify the true bottleneck using the **Snowflake Query Profile**. This shows whether queries are slow due to I/O, excessive sorting, or poor query design — so you can apply the right fix instead of guessing.How can I reduce Snowflake query costs without slowing performance?
Focus on **reducing data scanned** (filter early, avoid SELECT *), **preventing spills to storage**, and **using clustering keys for partition pruning**. These techniques cut both runtime and compute costs.Why are nested views (views on views) bad in Snowflake?
Views on views hide complexity, often leading to inefficient query plans and long troubleshooting cycles. Breaking queries into simpler steps or materialized tables gives both clarity and performance improvements.Does increasing warehouse size always improve Snowflake performance?
No. Simply scaling up a warehouse often wastes credits. Instead, **move only complex, long-running queries to a larger warehouse** while keeping smaller queries on smaller warehouses. This balances speed and cost.How do I avoid spilling to storage in Snowflake?
Minimize large sorts, check **GROUP BY cardinality**, and use **PARTITION BY** in window functions. If a query still spills heavily, consider running it on a larger warehouse — but test first.Why is SELECT * a bad practice in Snowflake?
`SELECT *` forces Snowflake to scan every column, even those you don’t need, increasing both runtime and cost. Selecting only required columns dramatically reduces data scanned and speeds up queries.What is partition pruning in Snowflake?
Partition pruning means Snowflake automatically skips micro-partitions that don’t match your filter conditions. Well-written WHERE clauses and clustering keys can make queries **hundreds of times faster**.How do clustering keys improve Snowflake query performance?
Clustering keys physically sort data in micro-partitions. This improves partition pruning, speeds up **ORDER BY / GROUP BY** operations, and helps large joins perform better.How can I make transformations faster in Snowflake?
Use **Change Data Capture (CDC)** instead of reprocessing full datasets. By only processing changed rows, you reduce compute cost and complete transformations much faster.What are the top three mistakes that slow down Snowflake queries?
1. Using `SELECT *` instead of specific columns. 2. Wrapping columns in functions (which disables pruning). 3. Overusing nested views and complex query chains.Takeaways
Use Snowflake Query Profile to identify true performance bottlenecks.
Keep query designs simple — avoid unnecessary complexity and “views on views.”
Be mindful with GROUP BY — check column cardinality before grouping.
Avoid spilling to storage — consider warehouse sizing and query design.
Scale warehouses smartly — move large queries to bigger warehouses, don’t just scale everything up.
Filter rows early and use LIMIT for better performance during exploration.
Avoid using OR in WHERE clauses — rewrite with UNION for faster results.
Don’t wrap columns in WHERE clauses — enable better partition pruning.
Avoid SELECT * — target only needed columns.
Maximize partition pruning with thoughtful WHERE clauses and clustering.
Cluster dimensional tables by join keys to accelerate joins.
ORDER and GROUP BY on clustered keys for faster sorts and aggregations.
Avoid row-by-row processing — leverage set-based operations.
Use Change Data Capture (CDC) for efficient incremental transformations.
Understand physical storage — clustering can reduce update/merge overhead.
Further Reading
Boost Your Snowflake Query Performance With These 10 Tips
Improve Snowflake Query Speed By Preventing Spilling to Storage
Best Practices to Maximize Query Performance Using Snowflake Clustering Keys
Best Practices for Reducing Snowflake Costs: Top 10 Strategies
Monitor Snowflake Usage & Cost
Data Engineer’s Guide to Snowflake ETL Best Practices


